Time to Rethink Bass Traps
|
Acoustics Defined* Perceived acoustics are a result of the decay of frequencies over time referred to as reverb. It is the coloration of uneven decay times that must be addressed in order to improve accuracy. Time is the challenge. Too often acoustics are approached solely from a frequency perspective. It is important to understand that acoustics are a combination of time and frequency. *From Acoustic: Basic Concepts, Guidelines, and Material written by S. Klein. |
“Enthusiastically sold on their benefits, and taken into this perennial belief
acoustic treatment starts with bass traps you may be ill advised.”
Time to Rethink Bass Traps
by Steven Klein
Are Bass Traps as important as we like to think? It is time to ask this question. Let’s first look at their history and evolution.
In the early, early days of acoustical recording, bass frequencies and transients could not be recorded, which is reflected in the popular music of the time. Dixieland had no bass and the drummer tapped on the rim of the snare drum. In early Jazz recordings a block of wood was used in place of the bass drum so as to avoid a booming bass. In the recording studio musicians gathered around a cone and balance was achieved by moving instruments away from the cone. The environment for this type of recording had to be without any type of bass frequencies; consequently, the first studio bass traps were born.
Electrical recording emerged as a new technology in the 1920s. The use of microphones as well as other electrical devices for movies and phonograph brought forth large audiences, increasing money to refine studios, expand technology, and develop equipment. Frequency together with clarity was quickly approaching 1950s Hi-Fi. Though in spite of these advances, low frequency was still limited, and consequently bass traps, high pass filters, microphone bottom-end chops, and composition were all employed to limit the dastardly bass.
Standards developed to address the technical challenges bass persistently presented. In 1952 the equalization standard for records, RIAA, began. According to Wikipedia – “RIAA equalization is a form of pre-emphasis on recording, and de-emphasis on playback. A record is cut with the low frequencies reduced and the high frequencies boosted, and on playback the opposite occurs. Another main benefit of the standard is that low frequencies, which would otherwise cause the cutter to make large excursions when cutting a groove, are much reduced, so grooves are smaller and more can be fitted in a given surface area, yielding longer playback times.”
Standards were developed for magnetic tape similar to RIAA. For 15ips recording, it was the NAB curve. The introduction of 24-track with its smaller track size created the AES curve which further reduced low frequency. At this time 30ips was the preferred tape speed as it had less noise and less bottom end. Dolby noise reduction became common in professional recording studios, which also used a pre-emphasis, de-emphasis system driven by dynamic range.
Other factors discouraging and limiting bass response include:
- Hardware technology: amplifiers, speakers, and microphones presented great challenges and limitations for low-frequency reproduction.
- Smaller control rooms, which limit the accuracy of bass monitoring, were the norm.
- Artists and record companies wanted longer LP’s. Standards went from 16 minutes per side, to 18 minutes and some established artists pressed onto more than 20 minutes. Because low frequency uses greater space on the disc, the musical content was more mid-range than lows.
- Cassette tape had limited low frequency and did not have the low noise and better dynamic range of vinyl LP’s.
- Bass was recorded direct, taking most of the space available for low frequency. Listening to direct feed with headphones meant the bass was not part of the recording acoustic environment.
- Popular music was broadcast on radio airwaves which had limited low frequency capabilities.
History makes clear, bass had to be “trapped” and virtually eliminated, therefore “bass traps” became the primary and most important acoustic treatment. Older than microphones and, glorious in both design and refinement, the bass trap was truly a star.
Let’s review how technology has affected musical content. Popular music in the 1950’s was all about vocals, vocal groups, and vocal stars. With the invention of overdubbing the lead vocalist, additional harmonies, plus vocal doubling created sounds never heard before.
In the 60’s full frequency began its ascent. Rock music and rock bands created a musical revolution accompanied by soaring record sales that spurred technical advancement. The “English” sound highlighted ambience and mid-range while the “American” sound brought to light the newly found bottom and top.
Simultaneously, producers and engineers began to have great influence; the illusion of “space” on the record was achieved. From the 60’s through the 80’s the “big sound” was supremely popular. Because vinyl has great dynamic range, “echo and ambience” were prevalent while the low-end was implied and reserved.
At the same time as “ambient space” was captured there was the other side of “dry” recording. Close mics, super control, and artificial ambience led the way to exceptionally produced, multi-layered recordings with meticulous attention to detail. Queen, Steely Dan, The Eagles, Fleetwood Mac and The Bee Gees are examples of the state-of-the-art recording and production techniques of their respective times. All used complete control and multi-track techniques to create original chart-topping sounds. None of these had the lower octave of bass at any significant level, all aided by the ever popular bass trap.
In 1982, the advent of digital compact discs had far-reaching and unintended effects on music and the music business. Unlike LP’s, CD’s have infinite bass capability and limited “ambient space”. Because sample rates decrease as dynamics decrease, the capability to appreciate true ambience disappeared. Producers and engineers reacted quickly to the changes in the medium. Since the mid-eighties, vocals and melodies have been drier and mid-rangey, while low-end has grown bigger and bigger. Movies also initiated this expansive bass with sub-woofers part of the THX standard as well as digital recording / playback.
Today the technical challenges and restrictions of low-end bass frequencies have been overcome. Case in point, Rap music, the ultimate expression of bass energy, rock and dance all pumping the low end, movies with their stunning soundtracks, sound effects, and dramatic explosions. Bass as the new frontier has been conquered.
Yet, confusingly, the bass traps’ popularity appears to be growing even though “bass trapping” is a throwback to earlier times and limitations. Enthusiastically sold on their benefits, and taken into this perennial belief acoustic treatment starts with bass traps you may be ill advised. Today’s number one acoustic blunder is too much bass trapping. For acoustic tuning of modern critical audio rooms the greatest challenges are in the low-mid-range (150 – 500 hz) verses the low end.
Let’s make the case.
Bass traps are necessary. The thesis of this article is not to eliminate bass traps but to make the reader aware of the dangers of over-trapping and the complexity of good design.
Fig 1. The modern acoustic designers’ goal is to have frequency decay evenly over time with bass having the longest reverb time.
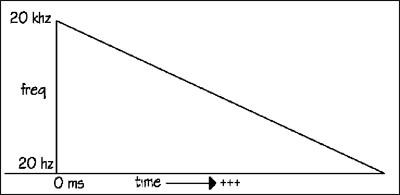 Fig. 1 Ideal Reverb Characteristic
Fig 2. The pre-1982 ideal had low frequency and modal response attenuate quickly.
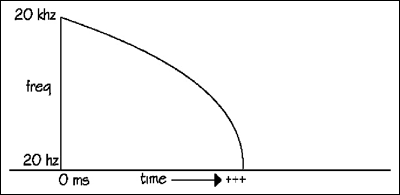
Fig 2.
An understanding of modal behavior is necessary in order to maintain bass. The accepted practice of bass trapping is justified because bass traps help diminish modal resonance and reduce unfavorable standing waves produced by boundaries and poor boundary ratios. Nevertheless, in modern audio we must keep the bass, knowing that the best acoustic is that demonstrated in Fig. 1.
Low frequencies have long wavelengths. Most rooms do not have the length to sustain true low frequency response. The lowest true note a 16.5’ boundary will sustain is 68.48 hz. Response for an 8’ dimension = 141.25 hz, 10’ = 113 hz, 12’ = 94.16 hz. ( Ref Fig. 8 ) Observe that 8’ is particularly nasty.
Note about illustrations: This is occurring on all planes, front to back, side to side, top to bottom. These examples show one theoretical plane only. Do not scale 20 – 20k, illustrative.
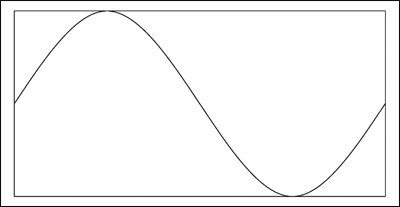
Max True Low Frequency
Fig. 3 Waves travel to the point of least resistance.
Defining Modal Behavior: Frequencies longer than the boundaries will modulate higher to points of least resistance, multipliers 2, 3, 4.
Defining Standing Waves: The interaction of the same frequency as it reflects from opposing boundaries.
Example: 30hz = 37.6’,
- 12’ boundary will produce 94.16 hz.
- (2x)188.32 hz.
- (3x) 282.36 hz.
- (4x) 376.64 hz.
Fig. 4 Illustrates the common practice where room tuning starts with bass traps, usually with broad band characteristics.
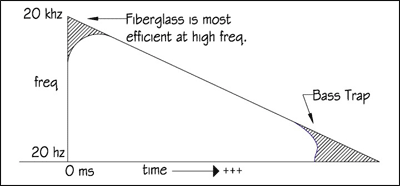 Fig. 4
Fig 5. Modal behavior increases low-mid reverb time.
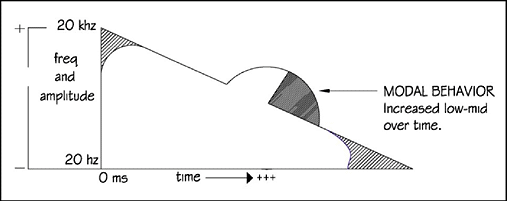
Fig. 5
It is quite evident that the room and its treatment remain far away from our ideal, illustrated in Fig.1.
Fig 6. In the real world
An untreated room has predictable characteristics. The low end is cut off and modulates according to the boundary. Mid-range increases as it bounces back and forth (aka; flutter). Reverb times will be choppy and too long. Speech intelligibility is not good enough for any type of audio.
The very top end is an area of no concern because it is often a matter of taste. Some speakers have little response in the very top end, 16 – 20 khz, which is typical of inexpensive bookshelf models, while others have extended range and have been selected for this reason. High frequencies (12 – 20 khz) decrease quickly and do not present reflection challenges.
The low-end is determined by speakers and boundaries, the subject of this article. Impose these characteristics to our bare room, and the real world model looks like this.
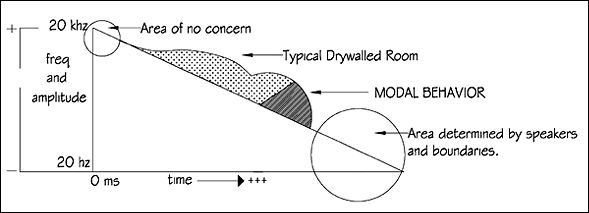
Fig. 6
Mid-range regeneration of a typical drywalled room (Fig. 6) is easily managed by fiberglass board or other types of absorbers, which explains why these types of products are popular and commonly used. As we are most sensitive to mid-range and its direction, these products are an easy and integral part of acoustic treatments.
However, lightweight or thin absorbers are most efficient at the upper mids and top end. It is easy to overdo treatments at these frequencies. See Fig. 7, fiberglass board specification, illustrates the imbalance of lightweight absorbers. If there is fiberglass board in the room, additional low-mid reduction (125 – 500hz) is necessary. This helps to balance the high frequency efficiency of these absorbers.
The area of modal behavior between 150 and 500 hz, is most critical. This is where all instruments are competing and it presents the most demanding challenges for accurate translation. Articulation here is difficult to achieve as we cannot sense the direction of these frequencies. Quantities are continuously changed by key, volume, arrangement, and reverb times. Modal behavior is difficult if not impossible to correct with speaker equalization because it is not an effect of the speakers; it is occurring later in time. Masking from accentuated low-mids makes the bass and bass drum hard to place.
Too much bass trapping makes it more confusing because you will tend to mix less bass in rooms that have less bass. (This will be addressed in other articles.) It must be clarified that the work taken out of the room represents the room and not the inverse. Dry rooms make dry mixes, bright rooms make bright mixes, and misleading acoustics make translation to mastering more difficult.
Examples of boundary / speaker interaction.
A. Monitoring with 5” or 6” woofers in a 20’ room with 12’ ceilings, it is a waste of money to buy bass traps. The speakers simply do not have the energy to excite problematic modal behavior.
B. Amidst a 22’ or greater room with sub-woofers, too many bass traps will diminish your investment in real-estate and equipment. This room should sound big and produce longer bass reverb.
C. Smaller rooms tend to have smaller speakers and we want to develop whatever lows we can. Bass already presents enough challenges; it does not make sense to extinguish it early in time as it is quickly being modulated.
D. Infinite baffle soffit speakers place great amounts of energy along the boundary and couple the speakers to the room. Large woofers and coupling create a great need for bass traps.
These examples demonstrate the complex interaction occurring between speakers and boundaries. Example “D” is typical of older professional studios. Realizing how important bass traps are in this situation leads one to think, “To be professional, I need bass traps”. However, in example “A” bass traps are absolutely unnecessary, in “B” limited, and in “C” questionable.
Conclusion
To properly employ bass traps one must be aware of the room/speaker interaction, be sensitive to the type of music/audio, have a reasonable expectation of the room’s natural size, and understand energy transfer into modal resonance. Good bass trap design will correspond with the boundary dimensions. Care must be given to assure the traps are not over efficient or oversized.
Every room requires absorbers and diffusors with cut off points higher than low frequency bass traps, 125 – 500hz. This is the place to have the greatest quantity of absorption because this is the place where most energy transfer occurs. Quantities and qualities are determined by room size, speaker size, loudness, and type of audio. Fortunately, many options in terms of style, size, and price are available today.
Because there are many complex factors that determine the type of acoustic treatment necessary and appropriate for a given space and function, bass traps should not be wholeheartedly presumed to be the initial, necessary, or greatest amount of acoustic modification. Always be aware that the real challenge in a modern music production room is between 125 – 500 hz, the multiplication of these frequencies is occurring later in time, and across all boundaries of the room.
Fig 7. Fiberglass board specifications.
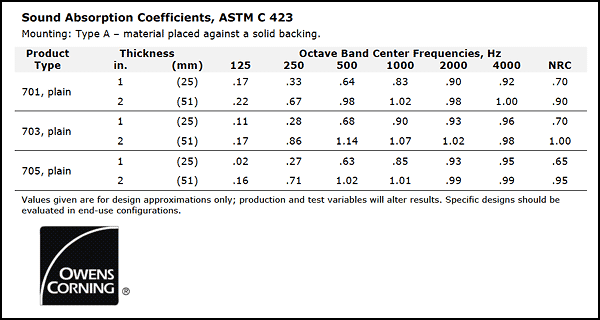
Fig. 7
Fig 8. Formula to determine frequency of a wavelength:
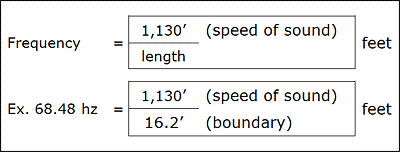
Fig. 8


